23-minute listen/watch | 13-minute read | 1-minute teaser
Flooding is the world's most devastating natural disaster, causing widespread destruction and loss of life. Millions of Americans live in high-risk flood zones, with the threat amplified by climate change and aging infrastructure. This episode explores how innovative computer modeling and visualizations can help communities plan for future flood risks and develop effective response strategies.
Transcript
Kaleigh Yost
As a society, we continue to build infrastructure in and move to floodplains. It's really important that we can communicate that risk to the people that are living and building in these areas. Without that communication tool, it's very difficult for the public and decision-makers to make informed decisions about when they should evacuate, how they should prepare, and what to do in the face of these increasingly frequent and severe flood events.
Host
Welcome to Growing Impact, a podcast by the Institute of Energy and the Environment at Penn State. Each month, Growing Impact explores the projects of Penn State researchers who are solving some of the world's most challenging energy and environmental issues. Each project has been funded by the institute's Seed Grant Program that grows new research ideas into impactful energy and environmental solutions. I'm your host, Kevin Sliman.
Flooding is the most common natural disaster on Earth. The global devastation from floods claims thousands of lives and inflicts billions of dollars in damages annually. In the U.S., an estimated 41 million people live in designated flood zones, a number that is steadily growing. Compounding the problem, nearly half of flood insurance claims occur outside of designated flood zones. Add to this aging infrastructure and intensifying weather patterns, which exacerbate the risk. Causes of floods can include heavy rain, rapid snowmelt, and storm surges. They can also occur when a levee breaks.
This episode of Growing Impact explores a research team's innovative approach to using computer modeling and animations to visualize future flood and levee failure scenarios, helping communities better plan, prepare, and respond to flooding threats.
Host
Hi, Kaleigh. Welcome.
Kaleigh Yost
Hey, Kevin. How's it going?
Host
Thank you for coming on Growing Impact. Thank you for coming and sharing about your research. It's an important topic, especially considering with climate change and the way that weather is changing. So I really appreciate you taking time and talking with us.
Kaleigh Yost
Absolutely. Happy to be here.
Host
Can you introduce yourself? Can you provide your name, your title and a little bit about your research background?
Kaleigh Yost
My name is Kaleigh Yost. I am the Kimball Early Career Assistant Professor in Civil and Environmental Engineering here at Penn State. And my training, my background is in geotechnical engineering. That's a branch of civil engineering that really deals with the engineering characteristics of soil and things built from soil. And my research is really centered on geohazards. So for example, characterizing soil conditions to understand how the ground might move during an earthquake or behave during an earthquake. Or more relevant for this project, modeling how an earthen levee will behave during a flood event. So that's kind of my interests and background.
Host
So you're working on a project that's creating realistic, 3D flood visualizations to better show communities the dangers of future flooding and failing levees due to climate change. Can you just walk through the basics of this work and what it's looking to do?
Kaleigh Yost
The goal of this project is really to integrate research in three different areas. So the first area is visualization and that's Peter (Stempel). The second area is hydrologic modeling. That's Cibin (Raj). And the third area is geotechnical engineering. And that's me. And so what we're trying to do is use state-of-the-art 3D visualizations to depict the results of rigorous scientific models of flood hazard and levee stability.
And so we're going to try to do this kind of in two phases. The first phase is parallel work. So Peter will work on developing the 3D infrastructure of a particular community. Cibin will work on the ecohydrological and hydrodynamic model that he already has set up for the Susquehanna River Basin. And then I will work on the levee stability models using the material point method, which is a geotechnical numerical modeling tool.
And then the second phase of the project is the convergence phase, where we incorporate all of these things together. So Cibin’s models, the hydrodynamic model is going to inform how I model levee failure, for example. So I'm going to take inputs from Cibin’s models to inform my models. And then the outputs of both my model and Cibin’s models will be given to Peter. And Peter will be able to translate those outputs into something that's really interesting and beautiful to view that hopefully communicate our results much better than we can as engineers. So that's kind of the idea. And so the point of the whole project is really to develop this toolbox that's going to allow us to be able to do that.

Host
Why is it important to create these visualizations and how do you foresee them helping a community?
Kaleigh Yost
Flooding is the most costly and common natural hazard in the U.S., and we know that existing ways of communicating flood hazard and risk aren't super effective. So we know that FEMA flood hazard maps, for example, are flawed in several ways. They're flawed in the fact that many of them are out of date. Parts of the country have never been mapped, and the other side of this is the public doesn't necessarily know how to interpret them.
So an example of that is about 40% of flood insurance claims actually come from areas that are outside of FEMA-mapped high-risk flood areas, right. So folks that are not being mapped, their community or their house is not being mapped in a FEMA flood, high-risk flood area. They think, well, I don't need to worry about flooding. And that's just simply not the case. And then even if you are mapped in one of these areas, it's really hard to kind of visualize or think about the kind of impact that a flood would actually have on your property and your community. So we think it's important to create these visualizations to be able to communicate better, not just to community members who live in areas where they might be impacted by floods, but also to the leaders and decision-makers who make policies and create plans to mitigate these hazards.
Those folks need to have a solid understanding of what might actually happen in their community. And it's also important for research. And I think we'll talk a little bit more about that later, how we can actually use these visualizations to inform our own research. So all of these things are important, and we hope that we can reach, kind of, all of these different stakeholders through this work.
Host
Are there examples of people doing work like this, and have you been able to learn from what they've done?
Kaleigh Yost
Peter has done an extensive amount of work creating these types of visualizations for coastal areas. So he has worked like, for example, a very well-known scientific model is ADCIRC, Advanced Circulation Model, and XBeach. These are two tools that he has already kind of meshed his techniques with. We don't use those tools to look at inland flood hazards, but he's essentially going to be doing something similar when he creates these visualizations for our models.
So it's helpful to see what has already been done. They've been using these types of visualizations in large-scale public engagement, across the northeast United States. And it's been shown to be very effective. So, exciting that he's doing this work already for other types of hazards, for coastal flooding, and exciting that we can now apply it to this, this new inland flooding hazard.
Host
Can you talk about where these visualizations will exist and how people will interact with them?
Kaleigh Yost
Yeah, that's a great question. I think we're still figuring that one out. The, again, like I said, the kind of the goal of this project is to create this infrastructure where we can make our models talk to his visualizations and have this useful output. We also hope that we can spend some time kind of exploring how appropriate different visualizations are.
So for example, the type of model output that I will be able to produce will show a levee and show different failure modes or potential failure modes of the levee. So whether that's the water overtopping the levee or the water doesn't have to overtop the levee for the levee to fail. We can have geotechnical failure that occurs beforehand. So maybe we have seepage through a levee that's causing instability.
My models will show that type of output. So Peter can create corresponding visualizations showing that levee failing and how it might impact the properties right immediately adjacent to the levee. And we can kind of compare how that visualization performs at communicating that hazard versus, the different type of visualization. You know, if we just showed inundation depth, for example, at that particular location. So we're hoping to kind of play around with the results that we get to see what's most effective.
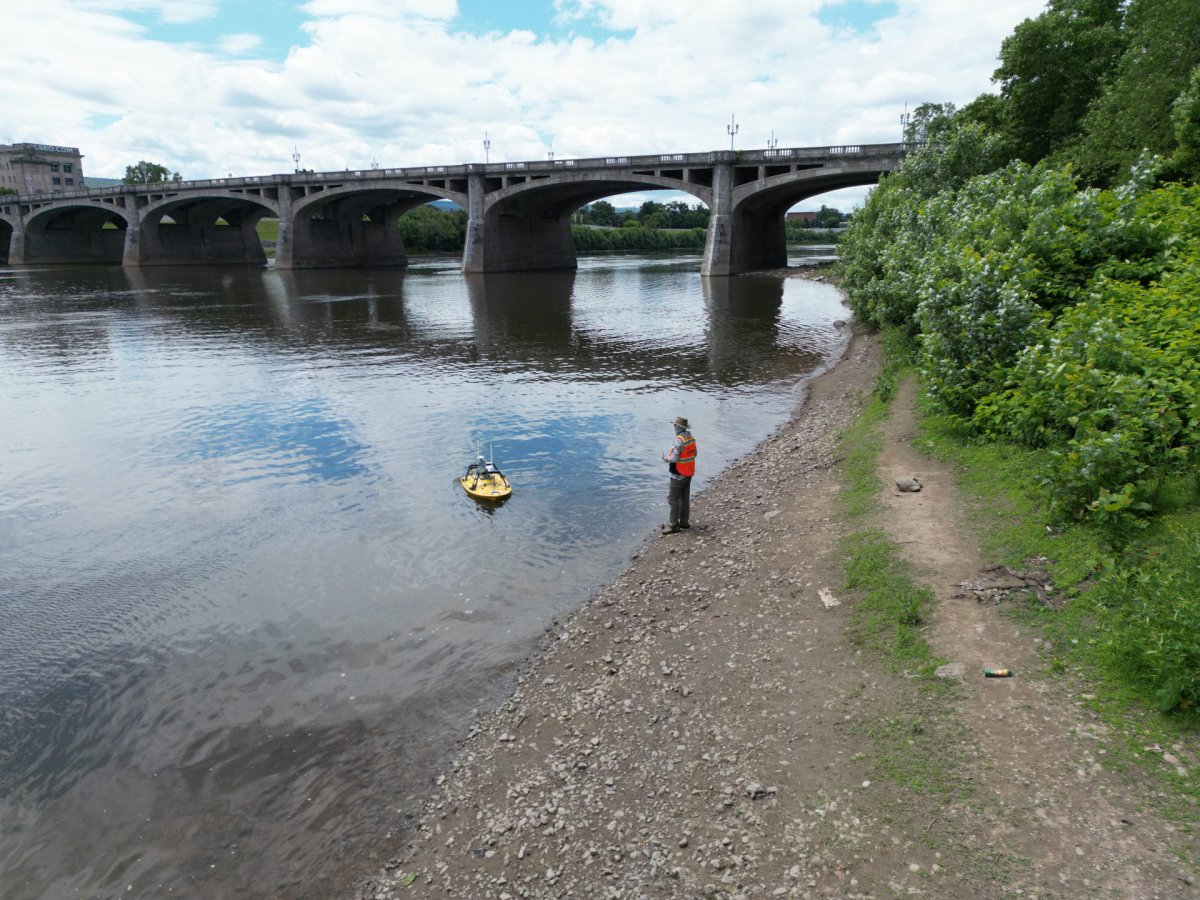
Another way we're hoping to use this is in our own research. So as a part of another project, we're looking at flood hazard in the Susquehanna River Basin. And we're creating a survey that's going to be sent out to communities. So to folks that live in these floodplains, and we want to know kind of their perception of their own flood risk, what their perception of levees are, whether they feel protected by their levee. And we also want to know if they understand the dynamics of how, for example, increasing the height of the levee in their town might actually impact flood hazard downstream.
So in other communities that don't get to have a say in that decision making. And as we were developing the questions that we want to ask in the survey, we're kind of racking our brains, you know, how are we going to show these hazards to the people that are taking the survey? And so this type of visualization will hopefully be really useful as we, as we try to do that moving forward.
So a lot of different potential ways to use these visualizations. I think we will try to also workshop them with some community members. So we have an ongoing partnership with the Luzerne County Flood Protection Authority. And they, you know, kind of oversee the whole levee system in that region. So being able to chat with them about what's useful for them, maybe some tools that they can use to help communicate to the people that live behind the levee, what their risks are, and things of that nature.
Host
Oftentimes we’re, we're reactive to flooding, right? Because it's happened. Do you anticipate or maybe hope that this will let us be a little more proactive on the front end? And so, whether planning or design or other things are able to be informed by this information?
Kaleigh Yost
Yeah, absolutely. Preparation and mitigation is key. And it's going to be really important as, especially as we start to see more intense, severe rainfall events that cause worse floods than we've seen in the past, the more frequent floods that we've seen in the past. It's going to be really important to kind of get that message across to these communities. You know, this is something that we can prepare for. You can't stop it from happening necessarily. But, we can prepare for this. We can anticipate it. And let's think about how we can handle these situations.
Host
Most people will have, you know, some sort of supercomputer in their pocket. Right. And wouldn't it be interesting to have, alerts or something that came through that your visualizations could actually show someone when it came through, like you're in this area and within a period of time it could look like this, and it actually shows them a visualization on their phone or on, you know, some other way. What more effective way of being like, where you're standing right now, it might be five feet underwater in an hour.
Kaleigh Yost
Right, right. Yeah. There's some very interesting potential applications in the virtual reality world for this. And we are discussing those potential applications because, yeah, you're absolutely right. I think we have a really big problem with not just communicating, you know, you should probably evacuate or if you must evacuate and people actually listening. Right? So hopefully creating more realistic visualizations will be an effective tool in getting that message across.
Host
Yeah. No one thinks it's going it right. It's like, it's not going to happen to me. My house is fine. I'll be fine. Then that person finds themselves on their roof trying to survive. Scary.
Kaleigh Yost
Right. Yeah. I just read a statistic that about half of the drownings that occurred during superstorm Sandy actually happened in homes that were flooded and were located in areas with mandatory evacuation orders. So those people knew that they were supposed to get out and they didn’t. So it's hard to imagine yourself in that position until it actually happens to you. But hopefully, creating more realistic visualizations will be a part of increasing the response to these types of orders.
Host
Have you considered or have you worked with someone with specialty in areas like psychology where that helps, you know, the understanding, the understanding of what decision making and the human mind in scary situations or, you know, anything like that and how that operates.
Kaleigh Yost
Yeah, I think that's a logical next step. Peter definitely does dabble a little bit in that in how the visualizations are perceived. So we'll certainly be looking into that. But yeah, I think there's a lot of work to be done and really understanding, you know, even if we're able scientifically to send out a perfect alert to perfect warning with enough time for people to leave, and we have the infrastructure in place for people to be able to do that. You know, what is actually going into that decision-making, and how can we kind of nudge people in the right direction? It’s an important question.
Host
So you mentioned the Susquehanna River Basin. Is that the area where you're working?
Kaleigh Yost
Yeah. So the larger scope of this, this work examines the entire Susquehanna River Basin, which is enormous. It covers about half of Pennsylvania and extends into New York and into Maryland. This is one of the most flood-prone watersheds in the U.S. On average, they experience about $150 million in flood damages every year. And there's a major devastating flood on average once every 14 years or so. So this is an important area of study and important for Penn State researchers to be involved in understanding what's going on in this floodplain.
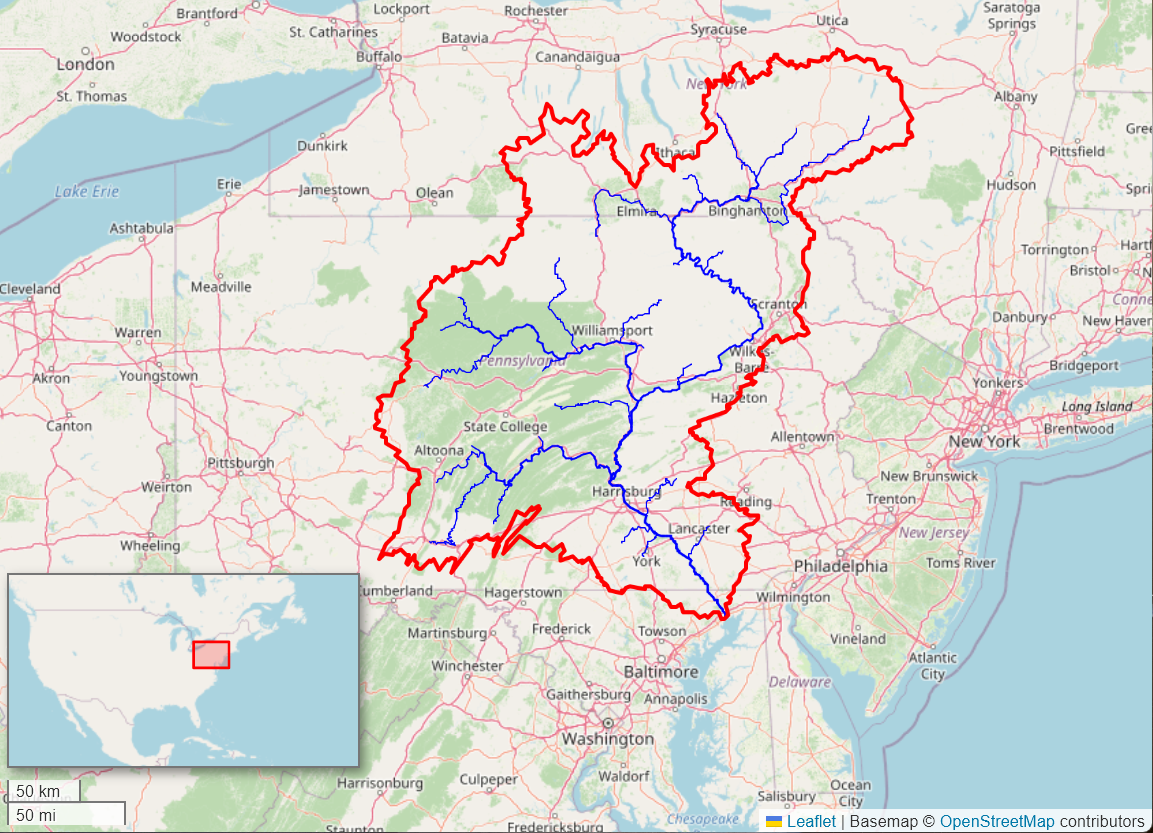
By Mheberger - Own work, CC BY-SA 4.0
For this project, specifically, we're zooming in, but very specifically on a community, the towns of Forty Fort and Kingston, which are located in Luzerne County, which is in northeastern Pennsylvania.
We picked these towns for a couple of reasons. They're protected by our very robust levee system that spans about seven miles. It's one of the largest levee systems in the entire Susquehanna River Basin. So behind it, there are 28,000 people, over 10,000 structures and 39 critical facilities like EMS, fire, police stations, schools, hospitals that are protected by that levee system. And there's been a long history of flooding in this area.
There's actually been several presidential visits because of how bad the flood damages have been historically in this region, most recently in 2011, Tropical Storm Lee, as it moved across the northeast seaboard, produced one of the highest discharge rates actually the highest discharge rate the levee had ever experienced. So very severe flooding was occurring in the region. And the levee was, it did not overtop, but the water level was very close to the top of the levee. And this is a very, very large, tall levee. And the levee did require some emergency repairs in some areas. And they had to make some, some modifications to the levee after the event. So this was, this is an important region.
There's a lot of people that live in this, the Scranton–Wilkes-Barre greater region in the northeast Pennsylvania, and it's an example of a very well-maintained levee system, but one that is still, you know, having its limits pushed, having its limits pushed in 2011, that was a while ago now. And so as we begin to look towards the floods of the future, we think it's important to understand how communities like this, especially the ones that are being protected by such a large levee system, may be impacted.
Host
Let's actually go over “levee.” And specifically, you said earthen levees, correct? Can you explain earthen levees and how they're positioned in the river or in the system and how they operate a little bit? Can you talk a little bit about that?
Kaleigh Yost
Levees are very can be very complex systems, or they can be very simple systems. But at the core, what we're looking at in this region in particular is an earthen levee that's positioned alongside the bank of the river. So this is almost a pyramid shape with a flat top. And it's made primarily out of soil that's been and it's engineered. In many cases, they're engineered levees, which means we've selected the type of soil that's being used to create the levee. We're controlling how that soil is placed. So we're making sure it's compacted, dense, to achieve the engineering characteristics that we want.
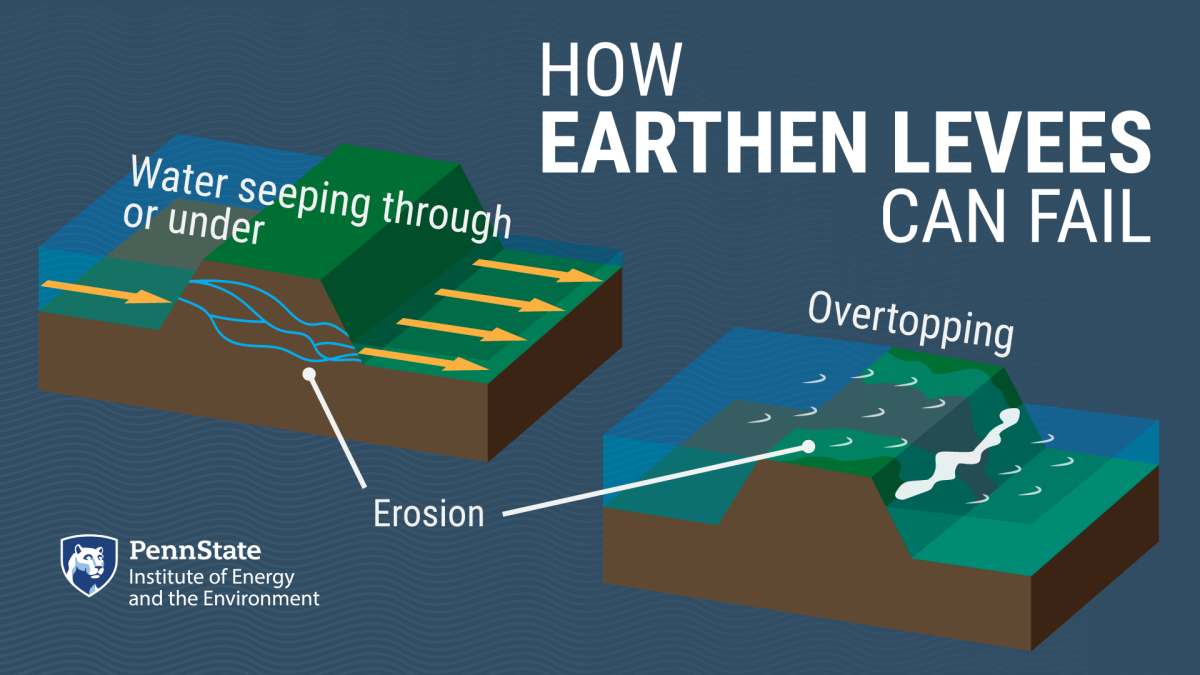
These levees oftentimes have drainage features that may consist of different type of soil that's directing water through the levee in a one way or another. And there are also other types of infrastructure that go into these levee systems that aren't necessarily made out of soil. So we have relief wells that can help with seepage of water moving from one side of the levee to the other and things like that. But ultimately, the goal is to serve as this engineering barrier that prevents the river, which is rising in height, from reaching the community on the other side.
Host
So this is building up the banks; essentially, you're building up the banks of the river so that it has walls around it. I know I'm simplifying it tremendously, but that's the idea. We're trying to put walls around the sides of the river to keep it flowing down the river bed.
Kaleigh Yost
Exactly, yep.
Host
Okay. Making sure, because when I think of levees, I also think of the levees that are used perpendicular to the flow of the river, right, where they're used, like a damming system, or I guess what I call it is there similar...?
Kaleigh Yost
They can use levees for agricultural purposes as well, in some cases, to redirect to the water and things like that. But yeah, the flood protection levees that we're talking about, at least in this region, are basically how you described: We're raising the banks of the river to prevent that water from spilling out into the community.
Host
So you're working in this area to begin with. And thank you, the explanation was excellent, and why you're why you're doing it. And the same with the explanation about what the levees are. And maybe this is too future-looking right now, but do you have plans to expand this and maybe make visualizations of other areas?
Kaleigh Yost
Yeah. Great question. So absolutely, again the idea kind of behind this project is to get these scientific models talking to the visualization tools. So building up that internal infrastructure and engine to translate our results into something that can be visualized, more, more easily and in a more effective way. So once that's in place, obviously, if we move to a different region, we're going to have to create a new infrastructure, a 3D infrastructure.
I will have to, you know, rerun my simulation for whatever – if we're looking at a levee, for example, for this new levee geometry and soil properties and things like that. Cibin’s work, looking at the larger hydrologic model, they have basically a model that looks at the entire Susquehanna River Basin. So it may be a little bit easier for him to zoom in on one area because that framework is already in place.
But yes, absolutely, we can apply this, and not just in the Susquehanna River Basin, but elsewhere, in other areas that are affected by inland flooding. And this is something that Peter can talk more about. But essentially this type of work, this type of visualization, looking at flood inundation, is something that's been, he's been working on pretty extensively in coastal areas, but hasn't really been done yet for inland flooding, and inland flooding, you know, this is something that occurs in every single state in the United States. So it's very relevant. And we hope to be able to apply it more broadly in the future.
Host
What are some next steps for this project? Maybe things either you're excited about or maybe challenges that you're looking to conquer at this point?
Kaleigh Yost
Yeah. So Peter just showed us that he's been working very hard on the 3D visualization of Kingston and Forty Fort already, and it was very impressive when he showed it to us. So I was very excited to see that. I mean, he's got, he's incorporated LIDAR data and other information about the infrastructure and the levee itself in that region. And to just be able to see the visualization of that even before we incorporate the flooding is pretty impressive. So that's very exciting.
Myself and Cibin both have incoming students this fall, I believe, who will be starting to dig into the nitty gritty on our scientific models, which is exciting as well. I think the biggest challenge is just going to be that this is the first time that this is really being done, that we're linking the types of models that we're using with the techniques that Peter uses to create the visualizations.
And so I think that part's going to be challenging. But once we develop that infrastructure to do that, we're going to be able to apply this, like I said, to many other regions as well. So that's what I'm most excited about.
Host
This is your chance. You're in an elevator with a U.S. senator or some other industry leader, world leader, whoever, and you have to pitch... You have 20 seconds to explain why this project is going to make a big difference. What do you have for your elevator pitch?
Kaleigh Yost
Flooding occurs in every single U.S. state and territory. It's a nationwide problem. Flood events are becoming more frequent and more severe with climate change. We know this. At the same time, the critical infrastructure we have to protect our communities against floods, like levees, are reaching or exceeding their design life. They're old. They're not in great condition. And they also weren't built to protect us against the floods of the future. So when these were designed, the types of flooding events that were occurring, back then are not the same as the types of events that are occurring now.
At the same time, as a society, we continue to build infrastructure in and move to flood plains. So we're putting ourselves in danger and at risk. It’s really important that we can communicate that risk to the people that are living and building in these areas. Without that communication tool, it's very difficult for the public and decision-makers to make informed decisions about when they should evacuate, how they should prepare, and what to do in the face of these increasingly frequent and severe flood events.
Host
Thank you so much. Thank you for being on Growing Impact. This was a great conversation, and I look forward to seeing more from your team. So thank you for coming on and talking about it.
Kaleigh Yost
Yeah. Thanks, Kevin. Pleasure to be here. So if anybody listening to this podcast is interested in what we're working on and interested in collaborating or has any questions, I would be happy to answer them. Feel free to reach out by email. You can find my information on the IEE webpage.
Host
This has been season five, episode two of Growing Impact. Thanks again to Kaleigh Yost for speaking with me about her project. To watch a video version of this episode, and to learn more about the research team, visit iee.psu.edu/podcast. Once you're there, you'll find previous episodes, transcripts, related graphics, and so much more. Our creative director is Chris Komlenic, with graphic design and video production by Brenna Buck, marketing and social media by Tori Indivero, and web support by John Stabinger.
Join us again next month as we continue our exploration of Penn State research and its growing impact. Thanks for listening.


