22-minute listen/watch | 15-minute read | 1-minute teaser
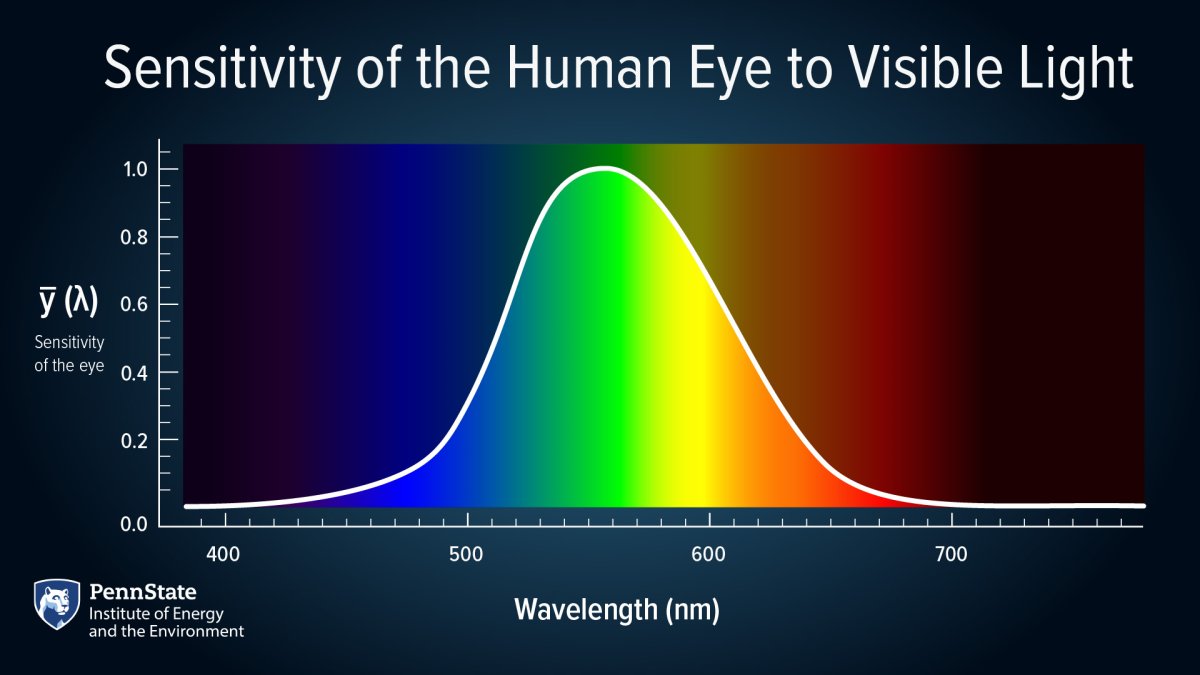
Lacking a standard unit for light measurement, scientists devised a spectral sensitivity curve in the early 20th century. This graph, representing an "average human observer," mathematically quantifies light. Though imperfect, it remains the standard today, but an update could significantly improve the energy efficiency of lighting.
Transcript
Alp Durmus
So now the spectral sensor curve is used to convert this electromagnetic radiation to what we call lights, which is kind of the small portion of energy that we as humans can detect. It allows us to quantify the amount of lights that humans can see, but also how efficient the lamps are.
Host
Welcome to Growing Impact, a podcast by the Institute of Energy and the Environment at Penn State. Each month, Growing Impact explores the projects of Penn State researchers who are solving some of the world's most challenging energy and environmental issues. Each project has been funded through a seed grant program that's facilitated through IEE. I'm your host, Kevin Sliman.
Before the early 20th century, light measurement lacked a standard, repeatable approach. At that time, scientists developed a spectral sensitivity curve representing the average human observer. This graph quantified light output and standardized lamp brightness calculations. Although experts recognized its imperfection and proposed alternatives, this graph remarkably remains the standard a century later. On this episode of Growing Impact, we discuss light sources, the measurement of those sources, and how updating this century-old standard could significantly improve energy efficiency.
Hi Alp, how are you?
Alp Durmus
Good. How are you, Kevin?
Host
Very well. Thank you for doing this, I appreciate it.
Alp Durmus
No problem. Yeah.
Host
Can you introduce yourself and provide a brief background on your research?
Alp Durmus
My name is Alp Durmus, and I'm an assistant professor at the Penn State University at the Department of Architectural Engineering. I'm doing research on color science, visual perception, and lighting systems, smart lighting systems. I'm interested in the effects of lights on humans and the environment. So some of the topics, include light pollution, circadian entrainment, energy efficiency, visual comfort, and visual performance.
Host
So you have a project with IEE, a seed grant project. The title is “Assessing the Energy Impacts of Electric Lighting using Alternative Spectral Sensitivities.” Can you provide an overview of it and maybe give some definitions around it, including some of the words that show up in there, things like “light source,” “spectral sensitivity curve,” and “light source efficiency.”
Alp Durmus
In an overall look, the project is trying to understand if our current approach to quantifying the efficiency of light sources is accurate. There are some alternatives in the way to the way that we quantify light, and we want to test these in a systematic way. And we want to see if what we do right now is a good method.
There are a lot of terminology, as you just noted. For example, “light source,” for us, is any object that emits light. So the sun is a light source. Fire is a light source. Incandescent lamps, LEDs are some of the electric light sources. It's a very broad term, widely used, but in lighting design or lighting research, we use more specific terms to define electric lamps, electric light sources such as lamps or luminaires.
So a lamp is the light-emitting part of an electric light source. A luminaire is the complete package. It can include base, reflectors, the lamp itself and everything else, like the wiring and all that kind of stuff. And light source efficiency refers to the amount of light emitted from a light source for the energy it consumes. For example, one light source, let's call it lamp A, can produce ten units of light per one watt, while a second light source, let's call it lamp B, can produce twenty units of light for the same watts.
So then we would say lamp B is twice as efficient as lamp A. And then we come to spectral sensitivity curve, which is a graph that basically shows how sensitive humans are, visually sensitive, can see different wavelengths of radiation. As you might know, electromagnetic radiation emits is, you know, traveling in space. And there's a lot of different types of radiation, including infrared, radio waves, gamma rays, x rays.
And humans are sensitive to only a small portion of this radiation, probably between 380 nanometers to 780 nanometers, which means we cannot see anything beyond or above 380 nanometers or 780 nanometers, which is very, very small, very, very tiny. So now spectral sensitivity curve is used to convert this electromagnetic radiation, radiant in space, everywhere existing, to what we call lights, which is kind of the small portion of energy that as humans can detect. It allows us to quantify the amount of light that humans can see, but also how efficient the lamps are, which is what we do in lighting research and lighting design.
We started this research project with computational simulation of what it would look like if we had alternatives to the standard observer, and if that would make any difference in the way we quantify energy efficiency. And our results suggest that there will be significant, statistically significant, differences between the standard approach and the alternative approach.
We also found that the alternatives could also make the change in the quantification of the color of the light source. That is why we intended to go a little deeper. And on that human experiments with, you know, visual experiments that involves human subjects so that we can quantify if these mathematical differences are indeed something that humans can see.

Host
Why is accurate quantification of light source efficiency important?
Alp Durmus
Well, accurate quantification of light sources is pretty important because consumers would ideally like to know the quality of a lighting product. Like we do this for different types of products every day, right? When we go to a store or we want to buy a product, we want to understand the performance of that product. So what we do is like we read labels, you look up information online, we try to understand how this product will work, or if it will work to the level that we want.
For light sources, energy efficiency, the amount of light coming from that lamp, or the color of the lamp are some of these aspects that are taken into account. So an efficient light source will reduce energy consumption so that we pay less bills, which is a great thing.
Host
What are the limitations of the current metrics used to measure light source efficiency?
Alp Durmus
Existing metrics are based on a spectral sensitivity curve that was being developed in the early 1900s, using visual experiments. This standard spectral sensitivity curve is also called "average human observer,” representing the whole of humanity. However, the scientists in the early 1900s noticed that this curve was not perfect. And they said, this is not a permanent solution, but they needed, at the time, a mathematical approach so that the other people can replicate it and quantify the amount of light.
Because before then, before 1900s, what they used to do was, light measurements or the amount of light were limited to experts, these people who judge lamps side by side, using their own eyes. As you can imagine, this is a very limited approach because you needed a person as an expert to be able to see how bright a lamp is. And an organization, international organization, published the standard observer, called “Average Human Observer” in 1924. But several researchers later on developed alternatives because they understood that this curve was not perfect.
Ironically enough, this is, 1924. It was 1924. Now we are in 2024. The “Average Observer” is 100 years old now.
Host
So how will your visual experiments compare the different brightness sensitivity functions?
Alp Durmus
Yeah, our experiments will compare the special sensitivities by generating lighting conditions that has a certain value for an average observer, if you quantify it for the standard observer, but it will have a different value of light if you want, or the alternatives. For example, you can have two lighting conditions side by side and the standard observer, the current standard that they use right now will estimate that they will look the same, but the alternatives will tell us that one of them is the brighter. And we will bring in observers, participants in our experiment, and we will ask them which one looks brighter and if they cannot see the difference, which means standard observer is correct. But if they indicate that the one that alternative said is a brighter is bright indeed, that means the alternative is better than the standard that they're currently using. So that's basically our approach.
Host
So are there ways. So you're literally using humans to help quantify it to calculate the brightness. Are there ways to utilize computer models or other ways that computers could just tell you how bright this is and it would then be really flat, you know, because everyone's eye, everyone's eyes are different? So I'm just curious, is that is that something that's reasonable or out there?
Alp Durmus
That's a common issue in vision research that there is inter-observer difference, is what we call it. Between humans there are some differences that makes this problem challenging. So without the human data, we can't really build models because all the computational models are based on human data. That's why we need the experimental data first. But if you have a large set of data, then you can use mathematical models and even artificial intelligence, so you know, some generated models, to predict what they will look for different types of people. So age we know makes a difference. Then of course there are certain eye conditions like, color deficiencies, red-green deficiency is very common among men. So those kind of things are limiting factors. So in our experiments we use a younger age group, 19–40 years old, relatively normal color vision, which means no color deficient take part in our experiments.
Of course, there are other experiments and other research groups have done, which kind of shows that you could actually have different age groups. For those age groups, you might need different curves. So that idea, the standard observer, the average observer represents humans, humanity overall is, a little far-fetched, I guess. But from the other perspective, from an engineering perspective, the other question that a lot of the photometric labs, light measurement labs, these people are kind of quantifying labs and how light is produced, also saying this differences between humans or between age might not be large enough to justify all these changes. You know you have to change the programming, you have to change equipment, you have to change everything. That's a little costly. So they are trying to understand the tradeoffs between the cost versus the accuracy or precision in the scientific, you know, understanding of human brightness perception.
Host
What are some of the potential benefits of developing more accurate lighting efficacy metrics?
Alp Durmus
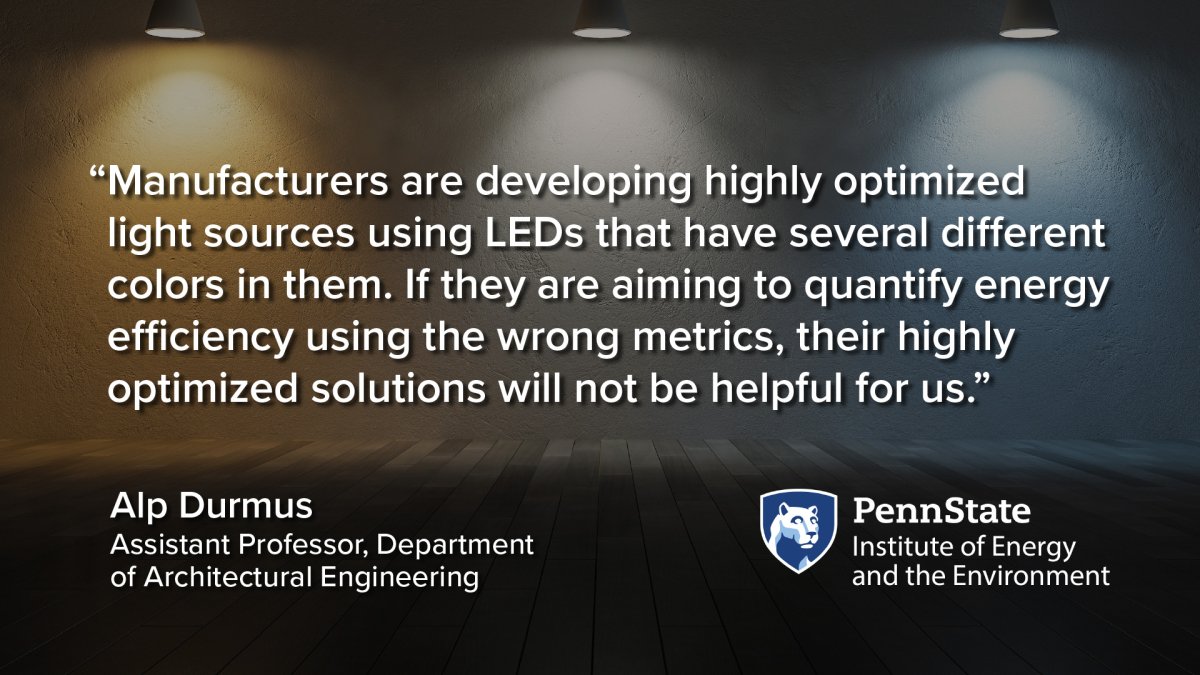
Well we'd like to believe that developing a more accurate quantification of the efficiency of light source will help the industry, the end users, and other researchers as well. So, for example, manufacturers are developing very highly optimized light sources using LEDs that have several different colors in them. So if they are aiming to quantify energy efficiency using the wrong metrics, their highly optimized solutions will not be helpful for us.
On the other side, end users, of course, would like to save energy in their bills, reduce their bills. But to be able to understand and make sure that they're truly saving energy, they have to use the right metrics. And so we want to confirm that what we are using right now is a good enough solution. From the research perspective, also, it's always good to be a little more precise and accurate when you're doing these calculations and measurements.
Host
How will the results of your project be used, or at least potentially be used, to develop new lighting efficacy metrics?
Alp Durmus
So we can use this, the new alternative spectral curves and the current metrics to quantify the output from a lamp. So instead of saying 50 units of lamp, our new metric could say it's going to be 48 or 55 units of lamp. And that will be more accurate. But beyond the quantification of a single light source a lamp, single luminaire, if you want, there are new approaches to quantify this holistic energy used in buildings.
One idea we are working on is light application efficacy. Lighting application efficacy (LAE) quantifies the amount of light that is observed by participants in any given space. So this is not just a light source, because you might have the most efficient light source in the world, but if there is no one in this space using it, that light is wasted, right?
So you can leave the space, light is on, it can be super-efficient, but no one is using, that’s wasted. So we want to quantify almost like observers' viewpoints and the time the people are using this space. Therefore our model will be much more holistic. And then in that model we can use different spectral sensitivity curves depending on the efficiency results that you find in this project. So this is some of these new ways I think we can quantify energy use and lighting use in buildings.
Host
Do you see any potential challenges as you're conducting these visual experiments?
Alp Durmus
There are a few challenges, and one of the most intriguing challenges is creating lighting conditions in these experiments that are ever so slightly different, so that a standard observer, an alternative, predict different lighting metrics if you want. As I mentioned early on, you can have two lighting conditions side by side and the predictions of the standard “average human observer” quote unquote and this alternative will make different predictions. But the curves are pretty much aligned in middle and longer wavelengths. And the bigger misalignment is in the shorter wavelengths, which is kind of what we see as blue. So, creating these conditions in our lab, the lighting lab, takes a lot of time, and it requires high-precision lighting systems that we have, that can be spectrally tuned.
So we need to create the spectral shapes and light sources that emit light in different wavelengths at different amounts. But it is a very long process, and it involves a lot of optimization, mathematical testing, you know, generating algorithms, testing this, measuring, going back, testing more, and evaluating the results. So it's a long, long, lengthy process.
Host
How did you get interested in lighting? Would you mind talking about that a bit?
Alp Durmus
Yeah, of course. I studied electrical engineering in bachelor degree, and one of the options was lighting. I got into lighting because I was more, a little more on the creative side. I got a lot of lighting related courses, indoor lighting, outdoor lighting, and I studied architectural lighting design. In Sweden I did my master's and I did my PhD in Australia, and my supervisor was a researcher, a vision researcher from the United States. She's my mentor, Wendy Davis. She's an amazing person. And I learned a lot about vision and color vision specific color vision and psychophysics and experimentation and that kind of truly changed the way I look at lighting and then kind of inspired me to be a research scientist.
So from then on, I knew that I wanted to do research. And I, of course, teach. I continue teaching lighting design and lighting color science, but trying to understand how human response, humans respond to lighting, and how can we use that knowledge to generate better products, better lighting systems, more efficient, but also creates visual comfort and does not really cause glare or all these bad things related to lighting, like flickering.
So this has been a fascinating journey for me. I had to jump to different things, but since my PhD, I think I knew that I wanted to be a researcher.
Host
Do you work with individuals who think about it from the psychological aspect, because of how the mind interprets different colors, for example? I know I've spoken with researchers on different seed grants actually for this podcast that, for example, they're using different colorations to make it feel warmer. So they use more of a red or a yellow. And so but it's not literally warmer. It's, you know, the light is making you feel warmer or think it's warmer. Do you have any connections with individuals working in that realm as well?
Alp Durmus
I believe you might be talking about Dr. Julian Wang, who is a faculty member in our department as well. He is the research project. I haven't done that research myself, but I know his research and some of my colleagues in back in Australia did similar work. In our lab, we do a couple of related experiments if you if you're thinking about color of the light and psychological responses. I’m not giving any much clue because we still that kind of conducting the experiments and kind of wrapping up the data collection. In one of the experiments, we're looking at the color of the light, which includes extremes like red, green, blue, and some white light source as well, and the effect of risk-taking, psychological perception of are you more inclined to take more risks under certain lighting conditions?
Which kind of came from some of the background literature that suggests that red lighting might make people a little more aggressive if you want, or risk taking, you know, or inclined to be risk taking. Another experiment we are also conducting about to be finished is looking up music and colored lighting. If it's changing people's subjective responses of the environment, but also their cognitive responses.
And then we're kind of asking questions about the, the subject, the response--if they like the environment, they're, you know, sleepy, alert, and a lot of different questions. But also we ask them to conduct cognitive tests. It's almost like an IQ test if you want and see if there's speed and if the number of correct answers will change under different lighting conditions.
And those experiments are very interesting because they could give us some insight into how human perception and cognition can change and be affected by lighting conditions. Of course, once you figure out, if we figure out there's some extremely significant differences, the next thing is going to be can we still see the similar results in normal architecture lighting conditions, which is white light because you don't see super-color lighting, saturated lighting in most architectural spaces, right? You don't see red, blue, green unless it’s an entertainment or is a venue that kind of, you know, has some sort of maybe, activity related to, I guess, lighting is going on. And so, yeah, we do some research on that area as well.
Host
Can we talk a little bit how the findings, how your findings from the research could be communicated effectively to stakeholders in lighting industry and building design field and maybe what that could impact?
Alp Durmus
Yeah. Well, we would like to talk to a lot of different types of people in and around lighting industry. So we often go to conferences and workshops, which are great places for scientific discussions because these are the venues that scientists prefer to go. So, I will present some of these findings, especially in a workshop in France this summer, ironically, organization who published the Standard Observer, is celebrating its 100 years this summer, this year.
So I will be giving a talk on the results of our experiments and with all of the other researchers in this area as well. Beyond that, of course, podcasts, websites, podcasts like yours, are great ways to reach our broader audiences because we need, I think, more interest in this topic, even though end users might not be, super-inclined to, you know, understand what is happening behind the scenes, but I think the even the end goal making a difference for them is, is an important point for us. So we try and do our best to spread the word. Which kind of brings me to this, and I would like to thank you for having me on this podcast, which is a great source, of course, for a lot of people around and, a good way for me to, you know, spread the word.
Well, thank you again for having me. And I would like to make a small announcement, I guess we are doing these visual experiments. And if you are in the State College/Central PA area, and if you are interested in taking a part in these visual experiments, feel free to reach out to me. And my email is alp@psu.edu. We are always looking for participants.
You can also use the Study Finder website as well. We have announcements on these different types of visual experiments, most often related to lighting of course, because I do lighting research. but sometimes we kind of do other stuff too. So, and if you're also interested in collaboration, if you are a researcher or if you have an intriguing question, if you want to pursue some lighting research and collaborate I'm happy to have a discussion as well.
Host
Thank you, Alp. Thank you so much for taking part in this. It was great. It was fascinating learning about this, and I think it was really eye-opening, no pun intended.
Alp Durmus
Well, no worries. Thanks for inviting me.
Host
This has been season 4, episode 11 of Growing Impact. Thanks again to Alp Durmus for speaking with me about his project. To watch a video version of this episode and to learn more about the research team, visit iee.psu.edu/podcast. Once you're there, you'll find previous episodes, transcripts, related graphics, and so much more. Our creative director is Chris Komlenic, with graphic design and video production by Brenna Buck, and promotional and social media support by Tori Indivero.
Join us again next month as we continue our exploration of Penn State research and its growing impact.
Thanks for listening.